

Spider Chart Pro app for iPhone and iPad
Developer: Treepi LLC
First release : 05 Jul 2015
App size: 18.75 Mb
About SpiderChart Pro
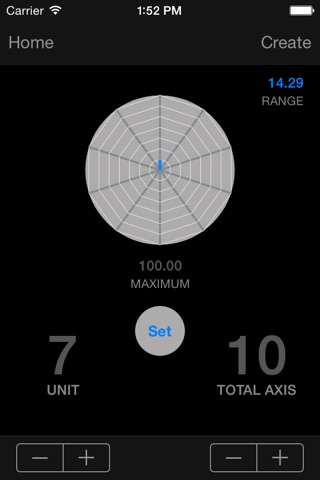
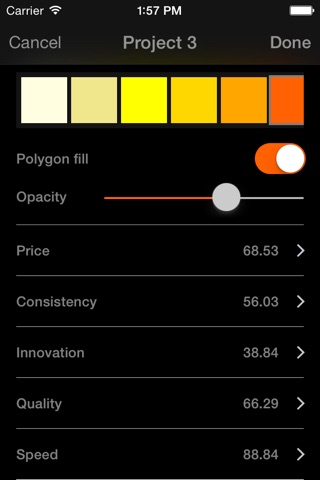
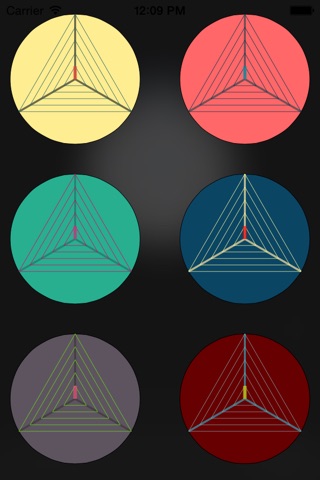
SpiderChart Pro enables user to create dynamic and customized radar chart on the go, it features complex animations and define graphics in a timely manner to distinct each element. Also allows user to save, edit and share final reports, as well as support for iCloud backup, and synchronizing user’s minimized data between multiple devices. Our goal was to make the user’s interaction as simple and efficient as possible by following the iOS Human Interface Guidelines.
What is Spider Chart?
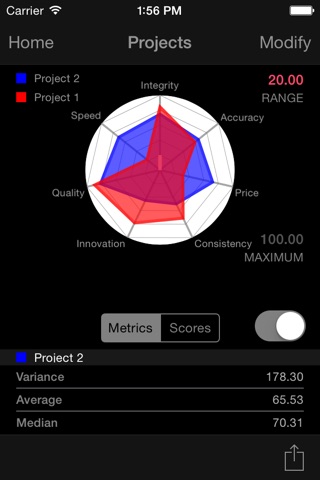
Spider chart also known as radar chart is a graphical way of presenting multivariate data in the form of a two dimensional chart of three or more quantitative variables represented on axes starting from the same point. The Spider chart concentrates on strengths and weaknesses of different categories which are normally between five to ten organizational performance areas.
When to use Spider Chart?
It is essential that a person or a team evaluates different perspectives of organizational performance area in order to provide an overall realistic and valuable picture of performance. e.g performance of vendors, and potential projects (Rated based on risk, return, initial cost…)
Where to use Spider Chart?
Spider chart can be used in different business applications such as skill analysis of employees, and product comparison. Also, it can be used by consultants to compare different companies and organizations. Spider chart is one of the best ways to control the quality improvement of any ongoing program. Furthermore, spider chart can be used in sport widely to display athletes’ strengths and weaknesses.
How to develop Spider Chart?
-Identify the alternatives to be compared
-Generate criteria to rate each alternative
-Rate each alternative based on criteria
-Draw and label the axis arms of the chart
-Analyze the chart
Developing Spider charts hints:
-Standardize ratings to some uniform scale(0-10 or 0-100%)
-Using different colors for each alternative